How CRE Debt Stands Apart and Why Reset Values Are Changing the Calculus

EXECUTIVE SUMMARY
"Private credit is not one market. We believe treating it as one is leading investors to misprice risk."
Private credit is not one market. We believe treating it as one is leading investors to misprice risk.
Recent headlines have focused on risks in private credit. Most of that concern is directed at corporate lending, not commercial real estate (CRE) credit.
That distinction matters. Corporate private credit and commercial real estate credit are fundamentally different businesses with different collateral, different loss drivers, and different outcomes in stress.
We believe now is an opportune time for CRE private credit. The repricing that has reshaped commercial real estate since 2022 (see “Real Estate Repricing Strengthened CRE Credit” below) has quietly strengthened the CRE private credit environment for new lending, creating structural tailwinds for disciplined investors.
A Structural Distinction for CRE Credit
Private credit is not monolithic: CRE credit is secured by tangible, income-producing assets. Corporate private credit, by contrast, is typically backed by enterprise value, cash flow projections, and increasingly aggressive capital structures. These are fundamentally different risk profiles.

A Structural Distinction for CRE Credit
CRE loans benefit from three characteristics that have historically differentiated their behavior across cycles:
- Tangible collateral. Every loan is secured by a physical asset with independently ascertainable value, providing a layer of downside protection that unsecured or enterprise- value-backed corporate credit may not offer.
- Conservative leverage. Today’s CRE loans are originating at historically low LTVs. As seen in Exhibit 1 on the previous page, Conduit CMBS weighted average LTVs have held near the mid-55% range in recent quarters, well below the nearly 70% average that prevailed before the Global Financial Crisis. The share of loans with LTVs exceeding 70% has fallen from 58% pre-GFC to just 4.6% in 2025. Underwritten debt yields have climbed from 9% pre-GFC to roughly 12.8% in 2025, and debt service coverage ratios remain robust at approximately 1.83x.
- Predictable property cash flows. Unlike corporate earnings, property-level cash flows are anchored by lease contracts, occupancy fundamentals, and often inflation- linked escalators, making CRE debt service coverage inherently observable and stress-testable.
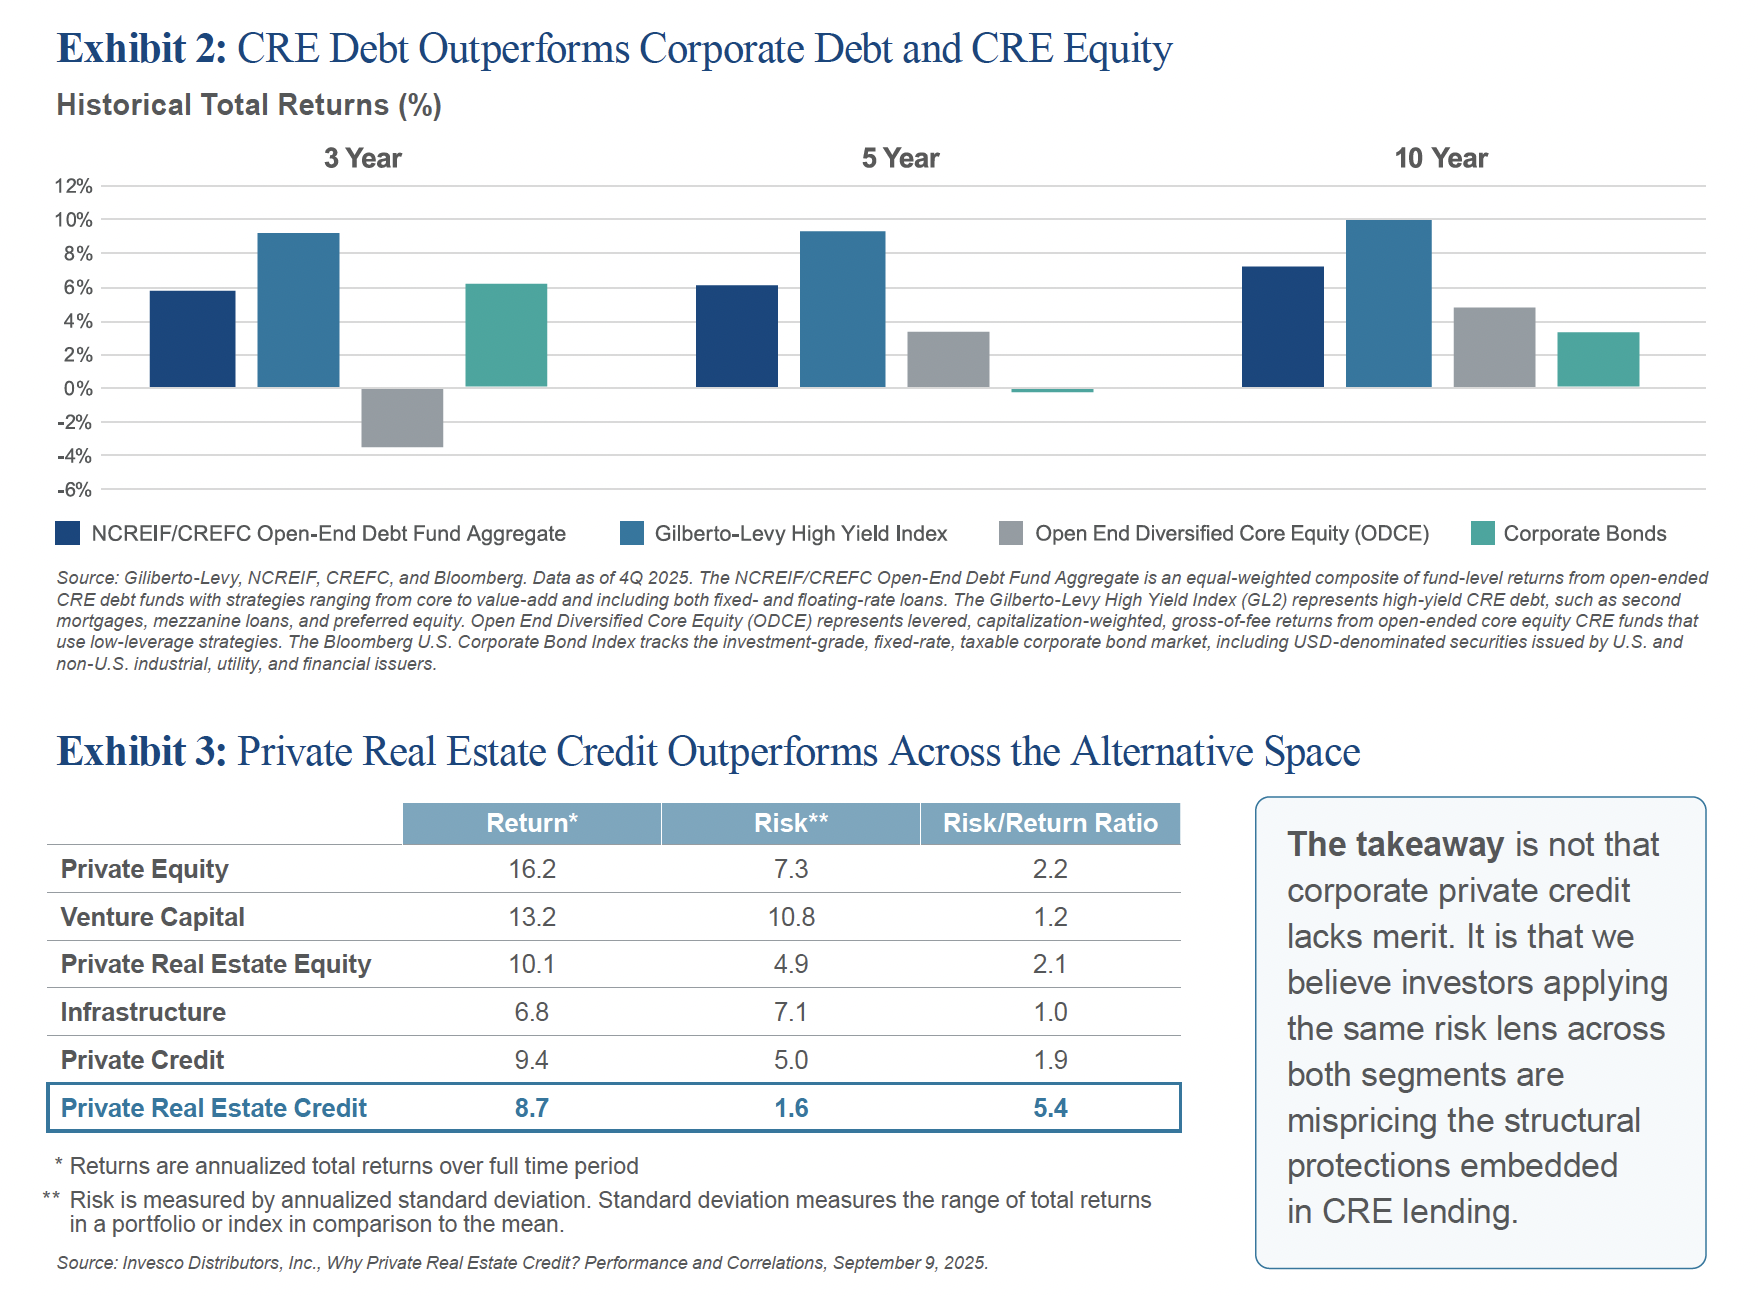
These attributes are not theoretical. Over five- and ten-year horizons, real estate credit has delivered stronger returns than real estate equity and corporate bonds (Exhibit 2 as shown below). Private real estate credit has also posted an annualized risk/return ratio of 5.4, more than double any other asset class in the alternatives space, and boasts the lowest risk, or annualized standard deviation of 1.6 (Exhibit 3 as shown below).
Real Estate Repricing Strengthened CRE Credit
Since interest rates began rising in 2022, CRE valuations have undergone material correction. The Green Street Commercial Property Price Index declined 14% from its 2022 peak through June 2026, with sector-level declines ranging from 2% in retail to 34% in office (Exhibit 4 below).
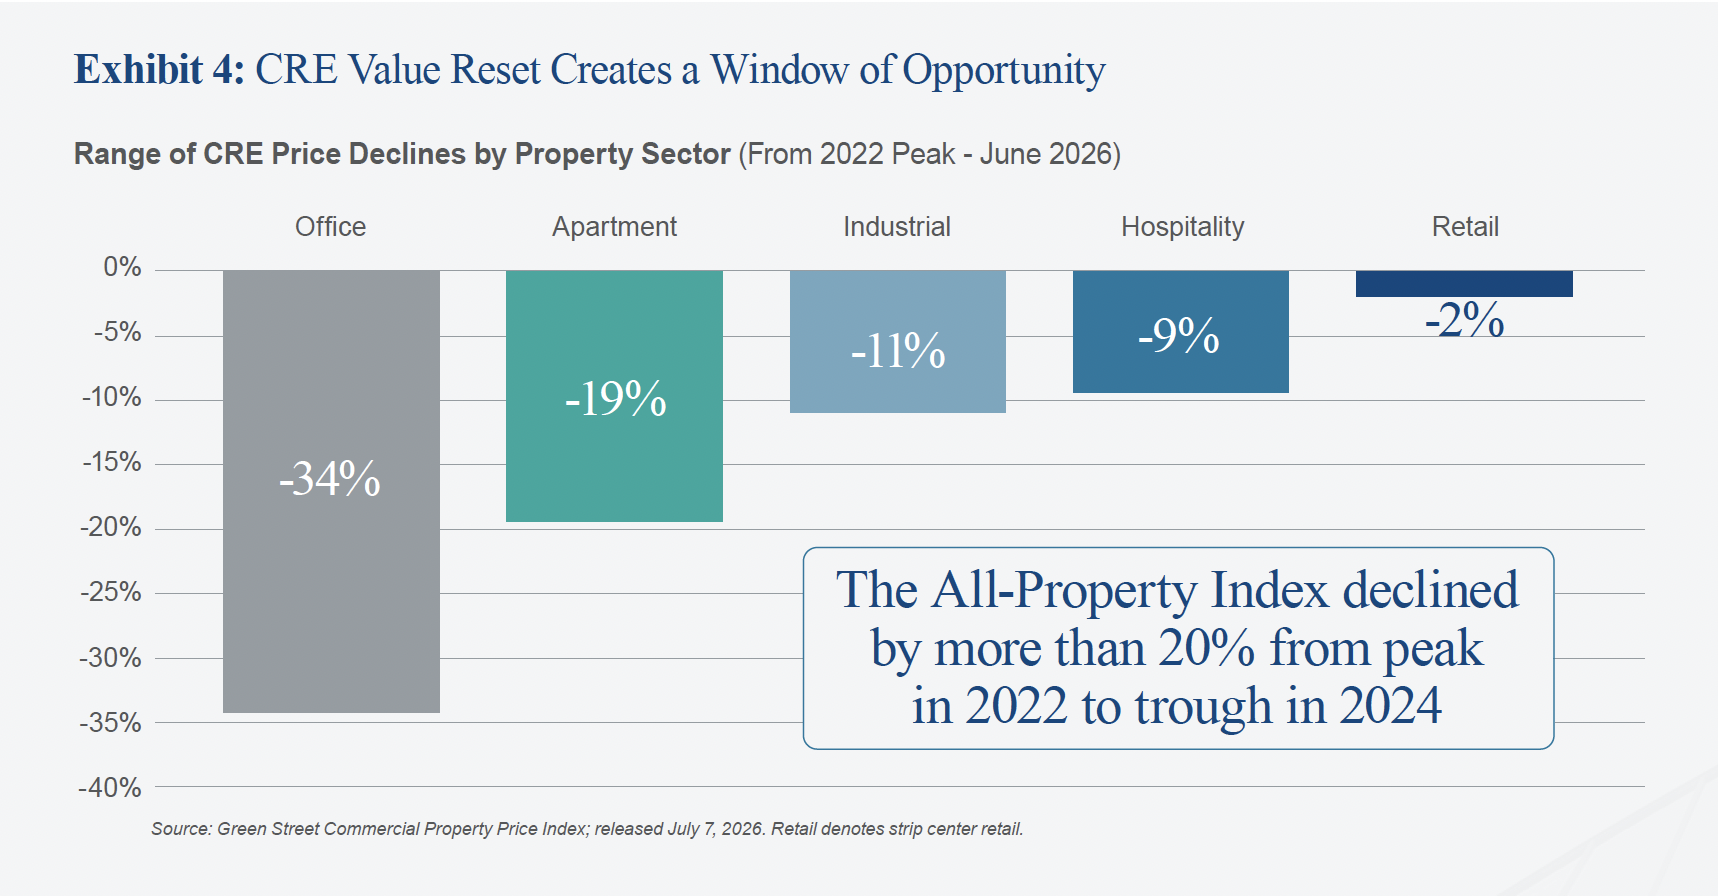
For equity holders, this repricing has been painful. For lenders, it has been transformative. Lower valuations mean newly originated loans are underwritten against a fundamentally more conservative collateral base. A loan originated today at 60% LTV is secured by an asset that should have already absorbed a significant valuation adjustment, thereby building in a cushion that loans originated at peak pricing never had.
This dynamic is especially pronounced in markets that experienced the sharpest dislocations. San Francisco offers a compelling case study. We believe few U.S. markets absorbed more compounding stress, pandemic-driven demand destruction followed by aggressive rate hikes, and few now present as strong a set of tailwinds: reset basis, dynamic demand driven by AI and technology leasing, and constrained new supply.
Multifamily vacancy in San Francisco compressed to 4% in the first quarter of 2026 with accelerating rent growth, supported by persistent housing undersupply. Office absorption has turned meaningfully positive, with total space leased by AI companies in San Francisco increasing 66% over the past two years to 6.3 million square feet. 2 Since January 2024, Prime Finance has originated eight investments across nine San Francisco properties in the hotel, multifamily, and office sectors, representing $439 million in total commitments at a weighted average LTV of 64.8%.
Across property sectors, we believe the story is consistent: reset valuations have established a more defensible lending basis, and improving fundamentals are reinforcing the cash flow durability that underpins credit performance.
Market Spreads Underscore the Case for CRE Debt
Even with strong fundamentals, we believe CRE credit continues to offer a meaningful yield premium relative to corporate credit. CRE lending spreads on bank balance sheet loans at 60%-65% LTV remain significantly wider than investment-grade corporate bond spreads. The post-COVID average spread differential has widened to approximately 91 basis points, double the 45-basis-point pre-COVID average (Exhibit 5 below).

A Macro Backdrop That Favors CRE Credit Discipline
In an uncertain environment defined by sticky inflation and higher-for-longer rates, corporate private credit remains exposed to earnings and valuation risk. By contrast, the defining features of CRE credit such as tangible collateral, observable cash flows, and conservative leverage, become more valuable in our opinion. Today’s loans are typically structured at lower LTVs against reset property values, creating larger equity cushions for lenders. In supply- constrained markets, we believe muted new supply construction can support occupancy, rent stability, and more durable property-level cash flows.

The Opportunity in Front of Us
The convergence is rare: reset property values, historically conservative underwriting, attractive relative spreads, constrained new supply, and a banking sector we believe has remained selective amid policy uncertainty and higher- for-longer rates. As refinancing needs mount, private lenders with rigorous credit processes should be well-positioned to finance strong assets on defensible terms.
Market commentary continues to treat private credit as a single asset class. We believe that framing is wrong. Investors who look beneath the headline should find that CRE credit occupies a distinct position today, often supported by tangible collateral, disciplined structures, and income streams that can be evaluated asset by asset.
For investors seeking income durability and downside protection, the objective is straightforward: capture attractive current yield while lending against stronger collateral bases and more conservative capital structures. We believe the current vintage may prove to be among the most compelling in recent memory.
Reach out for a deeper dive into any of these topics, or to explore how Prime Finance is positioning itself within commercial real estate credit markets.
Chris R. Miers
Principal, Head of Investor Relationships
(650) 449-6317
San Francisco 600 Montgomery Street Suite 1700 San Francisco, CA 94111
Chicago 155 North Wacker Drive Suite 3600 Chicago, IL 60606
New York 1330 Avenue of the Americas Suite 2500 New York, NY 10019
DISCLOSURES AND ENDNOTES
This communication is proprietary and for informational purposes only and is intended only for sophisticated investors and their respective representatives and advisors. It is not and should not be considered advertising materials or any other offer of investment advisory services by Prime Finance Advisor, L.P. or our investment teams (collectively, “Prime Finance”) with respect to any investment fund or security, and is not intended as an offer or solicitation with respect to the sale or purchase of any security. Statements contained herein that are not historical facts, including statements regarding trends, market conditions or the expertise or experience of Prime Finance, are based on current expectations, estimates, projections, opinions and/or beliefs of Prime Finance. Such statements are not facts and involve known and unknown risks and uncertainties. Certain information contained in this Presentation constitutes “forward-looking statements,” which can be identified by the use of forward-looking terminology such as “may,” “will,” “should,” “expect,” “anticipate,” “target,” “project,” “pro forma,” “estimate,” “intend,” “continue” or “believe,” or the negatives thereof or other variations thereon or comparable terminology. Due to various risks and uncertainties, actual events or results or the actual performance of an investment may differ materially from those reflected or contemplated in such forward-looking statements. Past performance is no guarantee of future results. Certain information contained herein has been obtained from published sources and other third parties. While such information is believed to be reliable for the purposes used herein, Prime Finance does not make any representation or warranty, expressed or implied, as to, or assumes any responsibility for, the accuracy of such information.
- CoStar data, multifamily in San Francisco. Pulled April 27, 2026.
- Behemoths of the boom: Ranking SF’s biggest AI companies by office size, by Kevin V. Nguyen, The SF Standard, published April 7, 2026.
Utilizing proprietary and JLL data. https://sfstandard.com/2026/04/07/i-leaderboard-san-francisco-office/; CoStar data, office in San Francisco. Pulled April 27, 2026.